
Gap analysis (conservation)
From Wikipedia, the free encyclopedia

Gap analysis[1] is a tool used in wildlife conservation to identify gaps in conservation lands (e.g., protected areas and nature reserves) or other wildlands where significant plant and animal species and their habitat or important ecological features occur.
Conservation managers or scientists can use it as a basis for providing recommendations to improve the representativeness of nature reserves or the effectiveness of protected areas so that these areas provide the best value for conserving biological diversity. With the information that a gap analysis yields, the boundaries of protected areas may be designed to subsume 'gaps' containing significant populations of wildlife species that can enhance the long-term survival of a larger metapopulation of the species already within the managed or protected area, or to include a diversity of wildlife species or ecosystems that merit protection but are inadequately represented in an existing protected area network. Gap assessments can be done using the geographic information system: land maps that delineate topography, biological and geological features (forest cover, plains, rivers, etc.), boundaries, land ownership and use are overlaid with the distribution of wildlife species. How much of the species' distribution fall within or without the conservation lands, or within a highly exploited area etc. can be identified.
At its simplest, a gap analysis is an assessment of the extent to which a protected area system meets protection goals set by a nation or region to represent its biological diversity. Gap analyses can vary from simple exercises based on a spatial comparison of biodiversity with existing protected areas to complex studies that need detailed data gathering and analysis, mapping and use of software decision packages. All gap analyses should consider a range of different “gaps” in a protected area network:
Representation gaps: either no representations of a particular species or ecosystem in any protected area, or not enough examples of the species or ecosystem represented to ensure long-term protection.
Ecological gaps: while the species or ecosystem occurs in the protected area system, occurrence is either of inadequate ecological condition, or the protected area(s) fail to address species movements or specific ecological conditions needed for long-term survival or ecosystem functioning.
Management gaps: protected areas exist but management regimes (management objectives, governance types, or management effectiveness) do not provide full security for particular species or ecosystems given local conditions.

Titled of Picture; doodlebulb
Gap dynamics
From Wikipedia, the free encyclopedia
 | This article needs additional citations for verification. (December 2012) |
Gap dynamics refers to the pattern of plant growth that occurs following the creation of a forest gap, a local area of natural disturbance that results in an opening in the canopy of a forest. Gap dynamics are a typical characteristic of both temperate and tropical forests and have a wide variety of causes and effects on forest life.
 Gaps are the result of natural disturbances in forests, ranging from a large branch breaking off and dropping from a tree, to a tree dying then falling over, bringing its roots to the surface of the ground, to landslides bringing down large groups of trees. Because of the range of causes, gaps, therefore, have a wide range of sizes, including small and large gaps. Regardless of size, gaps allow an increase in light as well as changes in moisture and wind levels, leading to differences in microclimate conditions compared to those from below the closed canopy, which are generally cooler and more shaded.
For gap dynamics to occur in naturally disturbed areas, either primary or secondary succession must occur. Ecological secondary succession is much more common and pertains to the process of vegetation replacement after a natural disturbance. Secondary succession results in second-growth or secondary forest, which currently covers more of the tropics than old-growth forest.
Since gaps let in more light and create diverse microclimates, they provide the ideal location and conditions for rapid plant reproduction and growth. In fact, most plant species in the tropics are dependent, at least in part, on gaps to complete their life cycles.[1]
Contents
[hide]Disturbances[edit]
Main article: Disturbance (ecology)

Gap dynamics are the result of disturbances within an ecosystem. There are both large scale and small scale disturbances, and both are influenced by duration and frequency. These all affect the resulting impact and regeneration patterns of the ecosystem.
The most common type of disturbance within a tropical ecosystem is fire. Since most nutrients in a tropical ecosystem are contained in the biomass of plants, fire is an important component of recycling these nutrients and therefore regenerating an ecosystem.
An example of a small scale disturbance is a tree falling. This can cause soil movement, which redistributes any nutrients or organisms that were attached to the tree. The tree falling also opens up the canopy for light entrance, which can support the growth of other trees and plants.
After a disturbance, there are several ways in which regeneration can occur. One way, termed the advance regeneration pathway, is when the primary understory already contains seedlings and saplings. This method is most common in the Neotropics when faced when small scale disturbances. The next pathway is from tree remains, or any growth from bases or roots, and is common in small disturbance gaps. The third route is referred to as the soil seed bank, and is the result of germination of seeds already found in the soil. The final regeneration pathway is the arrival of new seeds via animal dispersal or wind movement. The most critical components of the regeneration are seed distribution, germination, and survival.[1]
Forest gaps and forest regeneration[edit]
Until recently, forest regeneration practices in North America have largely followed an agricultural model, with research concentrated on techniques for establishing and promoting early growth of planted stock after clearcutting (Cleary et al. 1978, Lavender et al. 1990, Wagner and Colombo 2001),[2][3][4] followed by studies of growth and yield emphasizing single-species growth uninfluenced by overstorey canopy. Coates (2000)[5] questioned this approach and proposed a shift to a more ecologically and socially based approach able to accommodate greater diversity in managed stands. Predictive models of forest regeneration and growth that take account of variable levels of canopy retention will be needed as the complexity of managed forest stands increases (Coates 2000).[5]
Tree regeneration occurring inside canopy gaps after disturbance has been studied widely (Bazzaz and Pickett 1980, Platt and Strong 1989).[6][7] Studies of gap dynamics have contributed much to an understanding of the role of small-scale disturbance in forest ecosystems, but they have been little used by foresters to predict tree responses following partial cutting (Coates and Burton 1997).[8]
In high-latitude northern forests, position inside a gap can have a pronounced effect on resource levels (e.g., light availability) and microclimate conditions (e.g., soil temperature), especially along the north–south axis. Such variation must inevitably affect the amount and growth of regeneration; but relying solely on natural regeneration to separate the effects of gap size and position is problematic (Coates 2000).[5] Among the many factors affecting seedling establishment following canopy disturbance are parent tree proximity and abundance, seedbed substrate, presence of seed consumers and dispersers, and climatic and microclimatic variability. Planted trees can be used to avoid many of the stochastic events surrounding natural seedling establishment.
Gradients of canopy influence can be created by partial cutting, and tree growth responses within gaps of various sizes and configurations, as well as within the adjacent forest matrix can form a basis for tree species selection. Hybrid spruce (the complex of white spruce, Sitka spruce, and occasionally Engelmann spruce) was one of several coniferousspecies used in a study in the Moist Cold subzone of the Interior Cedar–Hemlock zone in northwestern British Columbia. A total of 109 gaps were selected from a population of openings created by logging within each light and heavy partial cutting treatment in stands averaging 30 m in canopy height; 76 gaps were less than 1000 m2, 33 were between 1000 m2 and 5000 m2. Canopy gap size was calculated as the area of an ellipse, the major axis of which was the longest line that could be run from canopy edge to canopy edge inside the gap, and the minor axis was the longest line that could be run from canopy edge perpendicular to the long line. Seedlings were planted in gaps and in the undisturbed and clearcut treatment units. There were strong and consistent trends in growth response among the seedlings as gap size increased. In all species, growth increased rapidly from small single-tree gaps to about 1000 m2, but thereafter, there was little change up to 5000 m2. Tree size and current growth rates for all species were highest in full open conditions. In large and medium gaps (300–1000 m2), the largest trees of all species occurred in the middle gap position, with little difference between the sunny north and shady south positions, lodgepole pine excepted. The light advantage expected off the north end of higher-latitude gaps was not a benefit for tree growth, suggesting that below-ground effects of canopy edge trees have an important influence of seedling growth in these forests (Coates 2000).[5]
In a study near Chapleau, Ontario (Groot 1992, Groot et al. 1997),[9][10] openings were created in 40-year-old aspen and monitored to determine their influence on outplanted white spruce seedling development. Circular openings 9 m and 18 m in diameter, 9 m and 18 m wide east–west strips, and a 100 m × 150 m clearcut were planted and spot-seeded. The variation in solar radiation, air temperature, and soil temperature among the strips and plots was almost as great as the variation between the clearcut and intact forest. Solar radiation during the first growing season varied from 18% of the above-canopy values within the uncut stand to 68% values at the center of the 18 m strip. Near the edges of the strips, solar radiation was about 40% of the above-canopy along the south and 70% to 80% along the north. Stomatal conductance in white spruce seedlings declined generally from more sheltered to more exposed environments, correlating best with increased vapor pressure deficit (VPD). Without vegetation control, position in openings had little effect on the growth of planted white spruce; regrowth of lesser vegetation isolated seedlings from the microclimatic effects of overstorey treatment. Seedling diameters were independent of environment, while height growth was only slightly greater in environments having more light. With vegetation control, white spruce diameter and height were greatest in the center of the strips, even though there was less light there than along the north edge of the strips. Moisture stress may have accounted for that result.
Primary succession[edit]
Succession is the slow rebuilding of forest gaps from natural or human disturbances. When major geological changes such as volcano eruptions or landslides occur, the current vegetation and soil may erode away leaving only rock. Primary succession occurs when pioneer species such as lichens colonize rock. As the lichens and mosses decompose, a soil substrate forms called peat. The peat, over time, will create a terrestrial ecosystem. From there on herbaceous, non-woody plants will develop and trees will follow. Major holes or gaps in the forest ecosystem will take hundreds of years to regenerate from a rock base.[11]
Secondary succession[edit]

Secondary succession occurs where a disturbance has taken place but soil remains and is able to support plant growth. It does not take nearly as long for plant regeneration to occur because of the soil substrate already present. Secondary succession is much more common than primary succession in the tropics.
Ecological secondary succession occurs in four distinct phases: First, rapid colonization of cleared land by species such as herbs, shrubs, and climbers as well as seedlings from pioneer tree species occurs and this can last up to three years. After that, short lived but fast growing shade intolerant species form a canopy over 10 to 30 years. Non-pioneer heliophilic (sun-loving) tree species then add to the biomass and species richness as well as shade tolerant species and this can last 75 to 150 years. Finally, shade-tolerant species regain full canopy stature indefinitely until another major disturbance occurs.[12]
Secondary succession in the tropics begins with pioneer species, which are rapidly growing and include vines and shrubs. Once these species are established, large heliophilic species will develop such as heliconias. Cecropias are also a major pioneering tree in the tropics and they are adapted to grow well where forest gaps are giving way to sunlight. Shade-tolerant species that have remained low in the forest develop and become much taller. These successional phases do not have definite order or structure and because of the very high biodiversity in the tropics, there is a lot of competition for resources such as soil nutrients and sunlight.
Examples of tree dynamics[edit]
Due to the fact that horizontal and vertical heterogeneity of a forest is significantly increased by gaps, gaps become an obvious consideration in explaining high biodiversity. It has been proven that gaps create suitable conditions for rapid growth and reproduction. For example, non-shade tolerant plant species and many shade-tolerant plant species respond to gaps with an increase in growth, and at least a few species are dependent on gaps to succeed in their respected environments (Brokaw 1985; Hubbell and Foster 1986b; Murray 1988; Clark and Clark 1992). Gaps create diverse microclimates, affecting light, moisture, and wind conditions (Brokaw 1985). For example, exposure to edge effects increases a microclimate's light and wind intensity and decreases its moisture. A study conducted on Barro Colorado Island in Panama showed that gaps had greater seedling establishment and higher sapling densities than control areas.
Species richness was higher in gaps than in control areas, and there was more diversity in species composition among gaps. However, this study also found that there was a low recruitment rate per gap, which explains why gaps differed in species composition. With 2% to 3% for pioneer species and 3% to 6% for shade-tolerant and intermediate species. Suggesting that most species could not take advantage of gaps because they couldn’t get to them through seed dispersal. With that said, the Janzen-Connell effect plays a major role in the tree species’ relationship with gaps. The Janzen-Connell density dependent mortality model states that most trees die as seed or seedlings. In addition, host-specific predators or pathogens are predicted to be greatest where density is greatest, which is underneath parent tree. This corroborates with the major causes of gaps, which are the falling of trees due to mortality caused by termites or epiphyte growth. The Janzen-Connell model also states that balance between dispersal distance and mortality should cause highest recruitment to be at a certain distance away from the parent. Therefore if these gaps are being created by the parents, the seedlings recruit away from the gap, resulting in increasing survival rates as the distance from the parent increases. This explains the low recruitment rate per gap found in the experiment conducted in Barro Colorado Island.[13]
In corroboration, a study conducted in La Selva in Costa Rica calculated the crown illumination index for nine tree species ranging from gap specialists to emergent canopy species. Crown illumination values ranged from 1, which indicated low light, and 6, which indicated that the tree crown was completely exposed . After using a mathematical model to calculate the changes in tree diameter and changes in crown illumination with age. This model helped estimate life expectancy, time of passage to various sizes, and age patterns of mortality. The results showed what most gap dynamics studies show, pioneer species thrived in high light environments and non-pioneer species showed high mortality when young but the rate of mortality decreased as they aged. However, once trees were very large survivorship then decreased.[14]


![\frac{1}{v \left [ \left ( {p_0}/{p} \right ) -1 \right ]} = \frac{c-1}{v_\mathrm{m} c} \left ( \frac{p}{p_0} \right ) + \frac{1}{v_m c}, \qquad (1)](https://upload.wikimedia.org/math/a/0/7/a07fa20831d01c3723d3bb42fa6645b5.png)
 and
and  are the
  is the adsorbed gas quantity (for example, in volume units), and
  is the
  is the BET constant,
 is the heat of adsorption for the first layer, and
  is that for the second and higher layers and is equal to the heat of
![{1}/{v [ ({p_0}/{p}) -1 ]}](https://upload.wikimedia.org/math/9/c/4/9c4aa0e0fd878bde044b1d30583148e0.png) on the y-axis and
on the y-axis and  on the x-axis according to experimental results. This plot is called a BET plot. The linear relationship of this equation is maintained only in the range of
  . The value of the slope
  and the y-intercept
  of the line are used to calculate the monolayer adsorbed gas quantity
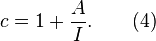
 and the
  are given by

 is
is  the adsorption cross section of the adsorbing species,
  the
the  the mass of the solid sample or adsorbent.


 and the y-intersection
  ; from this follows

 ). It follows thus
  which means that hardened cement paste has an inner surface of 156 square meters per g of cement. However, the article on